Last week Anthropic published three measurements of how its own models get built, under the argument that the public should be able to watch the pace of AI development from outside the labs. The headline that travelled was one number: Claude “leads” 26% of Anthropic’s AI research and development, as of August 2026, up from under 1% in February.
I want to take the number seriously, which means reading the appendix. Anthropic published one, and it is more candid than the headline. It describes a measurement pipeline in which Claude performs every step but the staff sampling and the final sum, a validation check whose result undercuts the precision of the headline, and an uncertainty band that the company drew on its own chart and then never returned to in the text.
None of that is a gotcha. It is all disclosed, on the page, by the company being measured, which is the unusual thing here. Most labs publish the number and not the method. The criticism below is possible only because Anthropic did the opposite.
What “leads” means
The scale is not Anthropic’s. It borrowed a six-point “Automation Level” ladder from Epoch AI, running from AL0 (no AI involvement) to AL5 (fully autonomous, no human in the loop). The 26% is the share of work rated AL4 or above.
Anthropic’s own footnote makes the levels concrete with a broken nightly data pipeline. At AL3, “collaborates,” an engineer brings Claude the logs, probably with a hypothesis already in hand, and stays in the loop: if a second problem surfaces mid-fix, Claude stops and the engineer decides what to do. At AL4, “leads,” the engineer hands over the failure alert and walks away. Claude finds the cause, writes and tests the fix, handles surprises itself, reruns the pipeline against a copy of the data, compares the output to the last good run, and writes up what it changed. Then it tags the engineer, who reads the write-up and decides whether it ships. Claude does not deploy. At AL5, which Anthropic says it has not reached for any measured subset of the work, nobody has to be told at all.
The distance between AL3 and AL4 is, in that example, whether the human has to stay tuned in. It is a real distinction. It is also a judgement call, and the whole headline rests on which side of it each piece of work falls.
How the 26% is made
The construction is bottom-up. For each week of July 2026, Anthropic randomly sampled 20% of staff from each department in the model R&D loop. A Claude research agent read each sampled person’s week through Slack and internal documentation and listed what they worked on. That produced roughly 15,000 granular tasks, which Claude then organised into a hierarchy: 542 nodes, 378 of them leaves, with names like “eval platform defect diagnosis and fixes” and “serving incident postmortems.” The tree is then frozen, so that every later measurement runs against the same basket of work.
For each node, a Claude agent researches how that kind of work is really done across the company, and an independent Claude judge reads the evidence and assigns an automation level. To turn 542 ratings into one number, each node is weighted by person-time. That is Claude again, reading what each sampled person worked on that week and giving every person one unit per week split evenly across their tasks. Anthropic calls this “a crude approximation,” which it is, and defends it on the grounds that it behaves sensibly on average, which it probably does.
So the number counts nothing. It aggregates ratings, and the evidence behind each rating is a model’s reconstruction of what people were doing from the traces they left in chat.
The check, and what it found
Anthropic validated the judge against people. Staff who own the relevant work areas rated the automation of their own areas, blind to what evidence the models had gathered and how they had graded it. The result, in Anthropic’s words: “Our judge model agreed with humans about as often as humans agreed with each other (model-versus-human exact agreement was 59%, human-versus-human was 35%), and model and human ratings were within one level of each other 97% of the time.”
Read that twice. The sentence is written as reassurance about the model, and it is: 59% is respectable. But the comparison number is 35%. Two Anthropic employees who own a piece of the work, shown the same piece of work, picked the same automation level about a third of the time.
That is the scale’s inter-rater reliability, and it is poor. Anthropic says so itself in the next line: “There remains real room for disagreement on borderline cases, such as where exactly ‘AI collaborates’ ends and ‘AI leads’ begins.”
Which is the boundary the headline is counted from.
The shape of the distribution makes this sharper. Anthropic reports that the share of work at or above “AI collaborates” is above 90%. Subtract the 26% at AL4 and above, and at least 64 points of the distribution are sitting at AL3 alone, parked directly beneath the boundary in question. The largest single band in the distribution is pressed right up against the line the raters are least able to agree on, which is the worst place for it to be sitting.
The interval Anthropic drew and did not discuss
The chart on the page carries vertical bars on each monthly point, labelled in small type at the bottom: “Vertical bars: 90% measurement intervals.” The prose never returns to them.
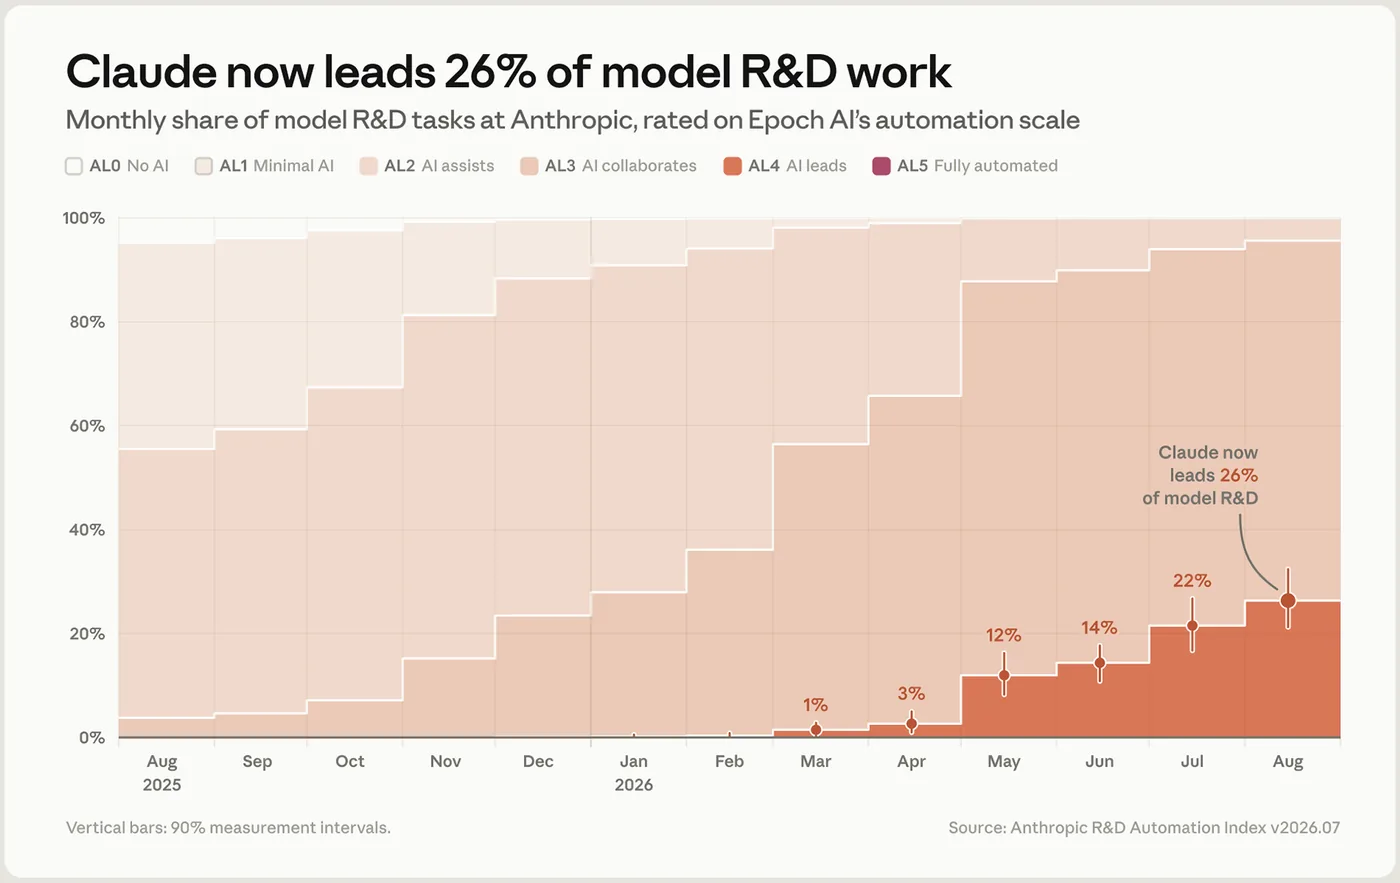
Anthropic does not publish the interval values as numbers, so I measured them off the chart’s own pixels against its axis. By that reading, August’s 26% carries an interval running from about 21% to about 32%, and July’s 22% runs from about 17% to about 31%. Those two intervals overlap across most of their length.
This matters for how the figure gets used. “Up from 22% to 26% in a month” is not supported by the company’s own error bars. “From roughly one in a hundred in March to roughly a quarter in August” is, comfortably. The index is a decent instrument for direction over half a year and a bad one for month-to-month movement, and the chart says so if you look at the bars rather than the labels.
There is a second wrinkle in the trend line. The basket of tasks was built from July 2026 data and then frozen, but the chart runs back to August 2025. Earlier months are rated by restricting the research agents to evidence from that month or earlier. That is a reasonable design, but it means the whole curve measures a July-2026 list of jobs against the past, not what people were actually spending their days on in late 2025. Anthropic checked this, building an alternate tree from January 2026 data and finding no rise in novel tasks between the January and July baskets, which is decent evidence that the shape of the work is stable. It is not the same as measuring the old work.
The other number, and what its remainder contains
Anthropic’s better-known claim is separate and older: that as of May 2026, more than 80% of the code merged into its codebase was authored by Claude. The two figures get conflated in coverage. They are different measurements of different things. One is a rating of tasks, the other a share of lines, and only one of them has a published methodology.
The footnote attached to the 80% is where the definition actually lives. Anthropic notes that its leadership has publicly estimated 90% or more of its code is written by Claude including scripts and experimental code, then says its own figure “measures the share of lines merged to production that can be attributed to Claude,” and calls that conservative for two reasons: “our attribution pipeline has gaps, and the lines not attributed to Claude include auto-generated code and other artifacts that were not hand-written by humans either.”
So the complement of the 80% is not 20% written by people. It is 20% not attributed to Claude, a category that explicitly includes machine-generated artifacts and whatever the pipeline missed. I have made the point before about the Times’ 93% and about Jev’s speed multiples: the number is usually fine and the denominator is where the meaning went.
Anthropic is candid about the productivity reading too. It reports that lines merged per engineer per day rose about 8× between 2024 and the second quarter of 2026, and then immediately says the multiple “is almost certainly an overstatement of the true productivity gain,” because lines of code measure quantity over quality. In a March 2026 poll of 130 employees across its research teams, the median respondent estimated producing around 4× as much output as they would have without AI; Anthropic’s own footnote says it expects the true uplift was lower, citing research that developer estimates of AI speedup run high.
That self-report gap is not unique to engineers. In a March 2026 NBER working paper surveying nearly 750 corporate financial executives, perceived labour productivity improvements from AI averaged 1.8% for 2025, while the gains implied by the same firms’ own reported AI-attributed changes in revenue and employment averaged 0.6%, a wedge of three to one between what executives thought they got and what their own numbers described.
Nobody can check any of this from outside
This bothers me more than any individual estimate does. There is, as far as I can find, no published methodology for independently auditing an organisation’s claim about what share of its work AI performs, and no such corporate figure has been independently verified. The nearest relevant evidence is discouraging: a 2025 study of automatic detection of AI-generated source code found the best classifier reached an F1 of about 82 within a single dataset and fell to roughly 45 once it was trained on one dataset and tested on another, so it did not survive a change of language or domain. You cannot audit a percentage when you cannot reliably tell which lines belong in the numerator.
Anthropic, to its credit, says this too, and proposes the fix: publish a common methodology so numbers can be compared across labs and over time, and have a third party verify them. It names the specific problem with its own approach, “we’re using our own models to evaluate our systems, which could mean that the ‘judge’ model could make the same kinds of errors as the model it is checking,” and says it plans to embed independent external evaluators with access comparable to internal risk teams. Until that happens, the index measures Anthropic using instruments Anthropic built, and publishes the instruments so you can argue with them.
One number in the margins suggests the underlying shift is real whatever the attribution says. In a footnote about infrastructure strain, Anthropic reports that GitHub saw roughly one billion code commits across all of 2025, and by mid-2026 was seeing 275 million a week, about fourteen billion on the year, with the platform’s COO saying it is “pushing incredibly hard” on capacity just to keep up. Nobody has to grade that. Commits are counted, not rated, and the count went up by more than an order of magnitude.
That contrast is the useful one. The things we can count about this transition, like commits and lines and tokens and compute, are going up steeply and are not in dispute. The thing everyone actually wants to know, how much of the judgement has moved, is the thing we can only rate. And the first serious published attempt to rate it comes with the company’s own admission that its human experts, grading work they personally own, agree with each other about a third of the time.
I would still rather have this document than not have it. Punishing a lab for the flaws its own methodology reveals just teaches the next one to publish the number alone. Read the appendix, quote the 26% with its interval attached, and ask the other labs where theirs is.
References
- Anthropic (2026). Measurements for understanding the pace of AI development inside frontier labs. Anthropic Institute, September 2026. Source of the 26% AL4 figure, the above-90% AL3 figure, the Epoch AI automation scale, the sampling and judging methodology, the 59% / 35% / 97% agreement figures, the ~30,000-agent and compute-allocation measurements, and the published chart.
- Anthropic (2026). When AI builds itself: Our progress toward recursive self-improvement, and its implications. Anthropic Institute, 4 June 2026, updated 18 September 2026. Source of the >80% merged-lines figure and its attribution footnote, the 8× lines-per-engineer figure and its caveat, the March 2026 poll of 130 employees, and the GitHub commit-volume footnote.
- Epoch AI. Automation Level scale (AL0–AL5), as adopted and described by Anthropic in reference 1.
- Baslandze, S., et al. (2026). Artificial Intelligence, Productivity, and the Workforce: Evidence from Corporate Executives. National Bureau of Economic Research, Working Paper 34984, March 2026. doi:10.3386/w34984.
- Suh, H., Tafreshipour, M., Li, J., Bhattiprolu, A., & Ahmed, I. (2025). An Empirical Study on Automatically Detecting AI-Generated Source Code: How Far are We? IEEE/ACM 47th International Conference on Software Engineering (ICSE), April 2025, pp. 859–871. doi:10.1109/icse55347.2025.00064. Cited as dated background for the limits of AI-code detection.