Last week a group from UC Berkeley’s Sky Lab and Arena Intelligence posted HarnessTax, a study of what the software wrapped around a coding model actually contributes. Melissa Pan, Shuo Yang, Negar Arabzadeh, Wei-Lin Chiang, Ion Stoica and Matei Zaharia ran seven models through three harnesses: Claude Code, OpenAI’s Codex CLI, and Pi, a minimal open-source agent. The benchmarks were SWE-bench Lite and Terminal-Bench 2.0, with 30 sampled tasks from each and three attempts per task. They reported three findings. The harness changes cost far more than it changes success. A minimal harness can compete. And a model often does better outside its own company’s harness, which gave the post its best line: “your Claude models may not need Claude Code.”
The page is rendered in the browser from JSON files, and those files hold more than the charts show. Every same-model comparison comes with a bootstrap confidence interval, a p-value, a Holm-corrected p-value, a per-task win/loss tally, and a one-line verdict from the authors’ pipeline, in words such as “cost survives Holm” or “not clear after Holm”. I read all of it. The first finding holds up, and it holds up well. The other two are mostly the sound of a small sample.
the bill
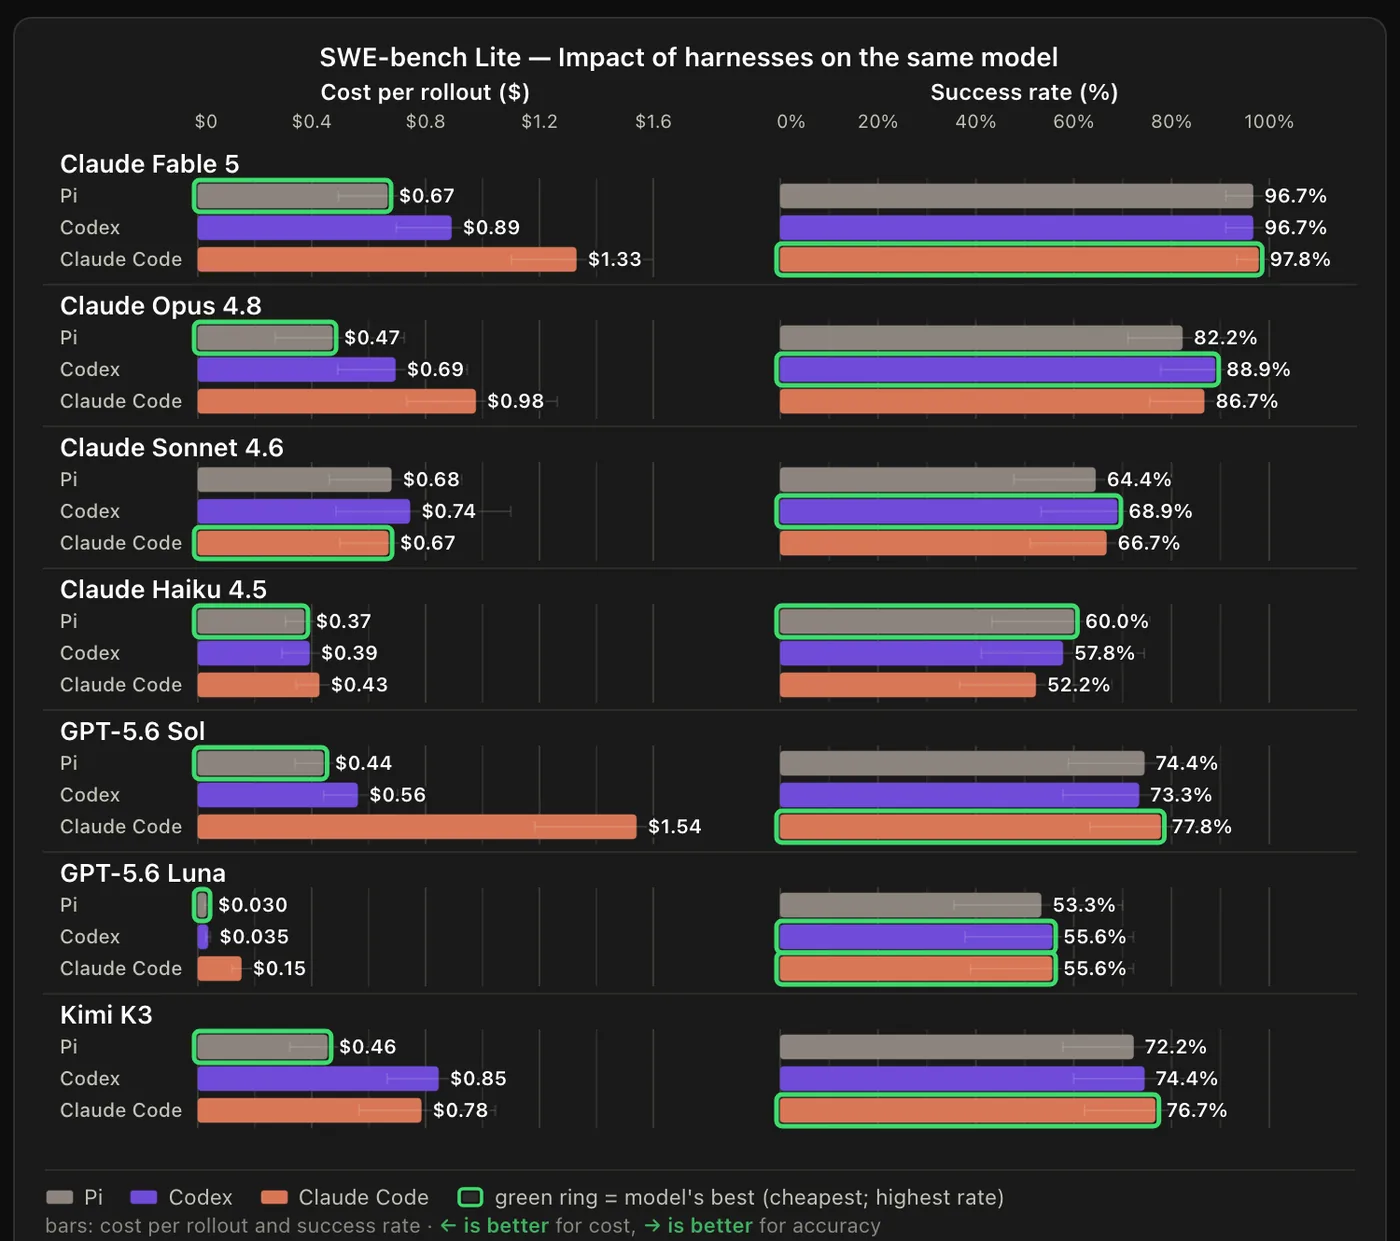
Start with the part that survives. Claude Fable 5 solved 97.8% of SWE-bench Lite attempts in Claude Code and 96.7% in Pi. It cost $1.33 per attempt in the first and $0.67 in the second. That is not a noisy average hiding a few expensive outliers: Claude Code was the costlier harness on 29 of the 30 tasks, and the 95% interval on the cost ratio runs from 1.76 to 2.33. Claude Opus 4.8 shows the same thing, 2.06 times the cost with Claude Code dearer on 29 of 30 tasks. Of the fourteen same-model comparisons against Pi on SWE-bench Lite, eight cost differences survive the authors’ own correction for multiple testing.
The headline “about 2.0×” deserves one qualification, and it is the kind that changes how you’d use the number. It is a geometric mean over all seven models, and three of those seven are not Anthropic models running in Anthropic’s harness. They are OpenAI’s GPT-5.6 Sol and Luna and Moonshot’s Kimi K3, run inside Claude Code, where the ratios are 3.5, 5.1 and 1.7. The “up to 5x” in the summary is Luna in Claude Code: 15 cents an attempt against 3 cents in Pi. That pairing is a real measurement, but not one many people pay for. Restrict the calculation to the four Claude models in Claude Code, the combination people actually run, and my arithmetic on the same data gives about 1.47×. And it is uneven. Fable and Opus pay double. Sonnet 4.6 costs 0.99× in Claude Code, marginally cheaper than Pi, and Haiku 4.5 costs 1.14×, with an interval that dips below 1×. So the tax is real, and it falls mainly on the two largest models.
The study’s best guess at where the money goes is the first model call. On SWE-bench Lite, Claude Code declares 23 tools and opens with a mean of 27,011 tokens of context; Pi declares four tools (read, write, edit, bash) and opens with 1,972. The authors are careful not to say this is the whole story, since caching, output length and later calls all matter, and I’d be careful too. A 27,000-token prefix that is re-read on every turn is billed mostly at the cache-read rate, and that rate is where much of an agent’s bill goes. It is still a prefix almost fourteen times larger, carried through every turn of every task. Databricks saw the same pattern on its own codebase in July: the same model at the same effort cost more than twice as much per task in some cases depending on the harness, at equal quality, and Pi sent about a third as much context per turn. That is not independent confirmation, since Zaharia is an author on both, but it is a second workload. The phrase itself is older than either study: Siddharth Sambharia of Portkey called it “the harness tax” in April, and HarnessTax cites him for it.
the scoreboard
Now the other half of the first finding: that success barely moves. The authors put it as the harness effect staying “within ±2%” on SWE-bench Lite. That is true of the averages. But look at what the averages rest on. Fable 5’s 97.8% against 96.7% is 88 solved attempts out of 90 against 87. On a task-by-task basis the two harnesses agreed on 28 of the 30 tasks and each won one. That supports a finding of no detectable difference. It is not evidence of equivalence to within a point, because a sample this size cannot measure to within a point.
The confidence intervals say so. On SWE-bench Lite, twelve of the fourteen success-rate intervals reach zero, and most are between ten and nineteen points wide. The two that clear zero both belong to Opus 4.8, and only one of them survives the Holm correction the authors applied: Opus does 6.7 points better in Codex than in Pi. On Terminal-Bench 2.0 the chart data labels every row “descriptive common-n30 estimate; no confirmatory test”. So the benchmark behind the post’s most quoted Pi result, GPT-5.6 Sol at 83.3% in Pi against 78.9% in Codex, was never tested for significance. The 4.4-point gap is four attempts out of ninety.
Sture Holm’s procedure, published in the Scandinavian Journal of Statistics in 1979, exists for exactly this situation: when you run many comparisons at once, some will look significant by luck, and his step-down adjustment keeps the chance of any false alarm across the whole set at 5%. The HarnessTax team ran it. Their pipeline wrote “not clear after Holm” next to comparison after comparison. Then the prose told the story the uncorrected numbers suggested.
nine of twelve
That brings me to the claim that got the most attention. “[A]cross the six Anthropic and OpenAI models and both benchmarks,” the authors write, “an alternative harness achieves the highest observed success rate in nine of twelve comparisons.” I checked the count against the chart data. It is correct: four on SWE-bench Lite, five on Terminal-Bench.
The operative words are “highest observed”. Each of the twelve is a three-way race between harnesses. If the harness made no difference at all, the model’s own harness would come first about a third of the time by luck, and some other harness would come first about two-thirds of the time. Across twelve races that is eight expected wins for the alternatives. The study found nine.
That binomial yardstick is rough: the comparisons share tasks, and ties muddy it (GPT-5.6 Luna’s Codex and Claude Code scores are identical on SWE-bench Lite, and the authors counted that as a home win). But the rough version is enough. Nine or more happens about 39% of the time with nothing going on. And the individual margins are the same size as the Fable result above. Sonnet 4.6’s lead in Codex over Claude Code is 68.9% against 66.7%, which is two attempts. Opus 4.8’s is 88.9% against 86.7%, also two. The widest is Haiku 4.5 on SWE-bench Lite, 60.0% in Pi against 52.2% in Claude Code, which is seven attempts, and its interval against Pi still reaches zero. The published tests compare each harness with Pi, so most of the nine were never tested head to head. Where one was (Haiku 4.5, Pi against Claude Code on SWE-bench Lite), it doesn’t survive the correction, and the five from Terminal-Bench weren’t tested at all. The one success difference that does survive, Opus in Codex versus Pi, is a race between two alternatives.
The fair reading of finding three is narrower, and still worth having: a model does not visibly suffer outside its maker’s harness. This study does not show that any model does better elsewhere.
It also can’t settle the larger argument it has been drafted into. In May, Yunbei Zhang, Chandan Reddy and colleagues published a position paper, Stop Comparing LLM Agents Without Disclosing the Harness, arguing that for long-horizon tasks the harness is often a stronger determinant of performance than the model. HarnessTax is being read as the opposite result. It isn’t. Its tasks are short, and its success differences are unresolved rather than shown to be zero. Failing to detect an effect on 30 short tasks says little about long-horizon work.
what changed since 2024
The question was not always this quiet. In 2024 the Agentless paper by Chunqiu Steven Xia and colleagues, later published in the Proceedings of the ACM on Software Engineering, lined up agent frameworks on SWE-bench Lite. The same GPT-4o resolved 18.3% of tasks inside SWE-agent at $2.53 a task and 32.0% inside the Agentless pipeline at $0.70. That was a swing of almost fourteen points in success, with the cheaper harness also the better one. Harness choice then moved both numbers a lot.
HarnessTax, two years and several model generations later, finds the success swing has collapsed into the noise, at least on these two public benchmarks, while the cost swing hasn’t. I suspect that is the more useful finding. My guess at the reason is that frontier models now bring enough of their own competence that a four-tool loop gets them as far as a 23-tool one does. The authors say something close to it themselves in their closing section: as models improve, “coding agents may need less of today’s scaffolding.” They also note the limits that apply here. These are two open benchmarks the models may have seen in training, and results may differ on other workloads. And thirty of SWE-bench Lite’s 300 tasks is a tenth of the set.
I wrote a few days ago that a speed multiple is only as good as what sits in the denominator. The same rule holds for a cost multiple. “Claude Code costs 2× Pi” is a clean, supported finding for Fable and Opus on SWE-bench Lite. It does not hold for Sonnet or Haiku, and the “5×” belongs to a pairing few people run. For success, the supported statement is plainer and less shareable: with 30 tasks and three tries each, none of these harnesses can be told apart. Before you move your Claude models out of Claude Code, check the bill. The scoreboard says nothing either way.
References
- Pan, M. Z., Yang, S., Arabzadeh, N., Chiang, W.-L., Stoica, I. & Zaharia, M. (2026). HarnessTax: How Much Does the Harness Matter for Coding Agents? UC Berkeley Sky Lab and Arena Intelligence, September 2026. Chart data (confidence intervals, p-values, Holm-adjusted p-values, per-task tallies) read from the site’s published JSON files, build dated 22 September 2026.
- Holm, S. (1979). A Simple Sequentially Rejective Multiple Test Procedure. Scandinavian Journal of Statistics, 6(2), 65–70.
- Gaba, V., Mathur, A., Singh, R., Wendell, P. & Zaharia, M. (2026). Benchmarking Coding Agents on Databricks’ Multi-Million Line Codebase. Databricks, 8 July 2026.
- Sambharia, S. (2026). The Harness Tax: The Dead Weight Inside Your Coding Agent. Portkey, 13 April 2026.
- Zhang, Y., Wang, J., Ge, Y., Xu, W., Hamm, J. & Reddy, C. K. (2026). Stop Comparing LLM Agents Without Disclosing the Harness. arXiv:2605.23950, 7 May 2026.
- SWE-bench team. SWE-bench Lite. Benchmark description (300 test instances). Accessed 24 September 2026.
- Xia, C. S., Deng, Y., Dunn, S. & Zhang, L. (2025). Demystifying LLM-Based Software Engineering Agents. Proceedings of the ACM on Software Engineering, 2(FSE). First posted as arXiv:2407.01489, July 2024.