Meta released TRIBE v2 on March 26, and the paper reached arXiv on May 5. The model takes a video, a soundtrack, or a transcript and predicts how a human cortex would respond. The abstract says it was built with “a unified dataset of over 1,000 hours of fMRI across 720 subjects.” Meta’s announcement contrasts the first TRIBE, “trained on the low-resolution fMRI recordings of four individuals,” with a new model that uses “a massive dataset of more than 700 healthy volunteers.” A reader could easily take that as four training subjects growing to seven hundred.
Table 1 of the paper says something else. The model was trained on 25 subjects. The other 695 are the people it was tested on.
Deep to learn, wide to check
The paper splits its eight datasets in two. Four “deep” ones, where a few people spent a long time in the scanner, were used for training: Courtois NeuroMod (4 subjects, 268.7 hours), Lebel2023 (8 subjects, 85.8 hours), BoldMoments (10 subjects, 61.9 hours), and Wen2017 (3 subjects, 35.2 hours). That is 25 subjects and 451.6 hours, about 18 hours each. Four “broad” ones, where many people were scanned briefly, were held out for testing: Narratives (321 subjects), LPP (112), HCP (176), and NNDb (86). That is 695 subjects and 666.1 hours, under an hour each.
Held-out sets are usually where I start poking, and this one is built the right way round. The authors say they kept the wide datasets for testing because training on deep data works better and because a reliable group-average response needs many subjects. The appendix states the comparison plainly: the first TRIBE trained on 4 participants doing one task, and this one trained on 25 participants across four tasks and was tested on 695 held-out participants. My complaint is with the launch copy. The announcement and the demo page never give the 25.
A small head on borrowed features
Little of what makes it a foundation model was learned from those brains. TRIBE v2 runs text through Llama-3.2-3B, audio through Wav2Vec-BERT 2.0, and video through V-JEPA 2 Giant, all frozen, then passes the combined embeddings through an 8-layer transformer and a subject-specific linear layer that maps onto the cortex. Extracting those features took 24 hours on 128 V100 GPUs. Training the brain-facing part took 24 hours on one. By my arithmetic that is 3,072 GPU-hours against 24. The authors also average the video features across image patches, which they say discards position and should hurt prediction in early visual areas that map space directly. What the 25 brains supply is a mapping from representations that other models already learned.
Two other numbers
The launch materials describe the output in a way the paper does not. Meta’s demo page says the model “predicts whole-brain activity across 70,000 voxels,” a far sharper picture than the “1,000 cortical predictions” of the first version, and the blog claims “a 70x resolution increase as compared to similar models.” The paper’s methods list 20,484 cortical vertices plus 8,802 subcortical voxels as the prediction targets, which sum to 29,286, about 29 times the first version’s 1,000 parcels. The released code returns roughly 20,000 vertices on the fsaverage5 cortical mesh. I couldn’t find 70,000 in the paper’s text, and the launch pages don’t say what it counts.
The model’s name for itself varies too. The blog calls it “a digital twin of human neural activity,” the demo “a digital mirror,” and the paper a “digital model.” Only the last is one the paper’s evidence supports. The code’s README says predictions are for the “average” subject, and a twin of a particular person would not be an average. The paper does show that fine-tuning on up to an hour of a person’s own data improves scores two- to four-fold over a linear encoder trained from scratch on that person. Read off the paper’s figure, though, those fine-tuned scores average between roughly 0.06 and 0.12 in correlation across the test datasets, so several-fold gains start from a low base.
What it predicts well
The strongest result is about the group, not the individual. Given a stimulus, TRIBE v2’s zero-shot output tracks the group-average response better than most individual subjects’ own recordings do. In the 7T HCP data, which has the best signal-to-noise ratio of the four test sets, the correlation is near 0.4, about twice the median subject’s. The demo puts it in plain terms: raw scans are noisy, and the model predicts “a canonical brain response.” That is a legitimate use, and the authors suggest piloting naturalistic studies with it before scanning anyone. But a single scan is a noisy sample of that average, which is what the number reflects. It does not show that the model can stand in for one person’s brain.
In silico, with stand-ins
The paper’s headline test replicates classic localizer experiments in silico. Predicted responses to flashed images recover the fusiform face area for faces, the parahippocampal place area for places, the extrastriate body area for bodies, and the visual word-form area for written characters. Language contrasts recover regions such as the temporo-parietal junction and Broca’s area. The results section presents the agreement as a qualitative match plus a significant spatial correlation across 360 cortical parcels, shown in figures rather than as a single coefficient in the text.
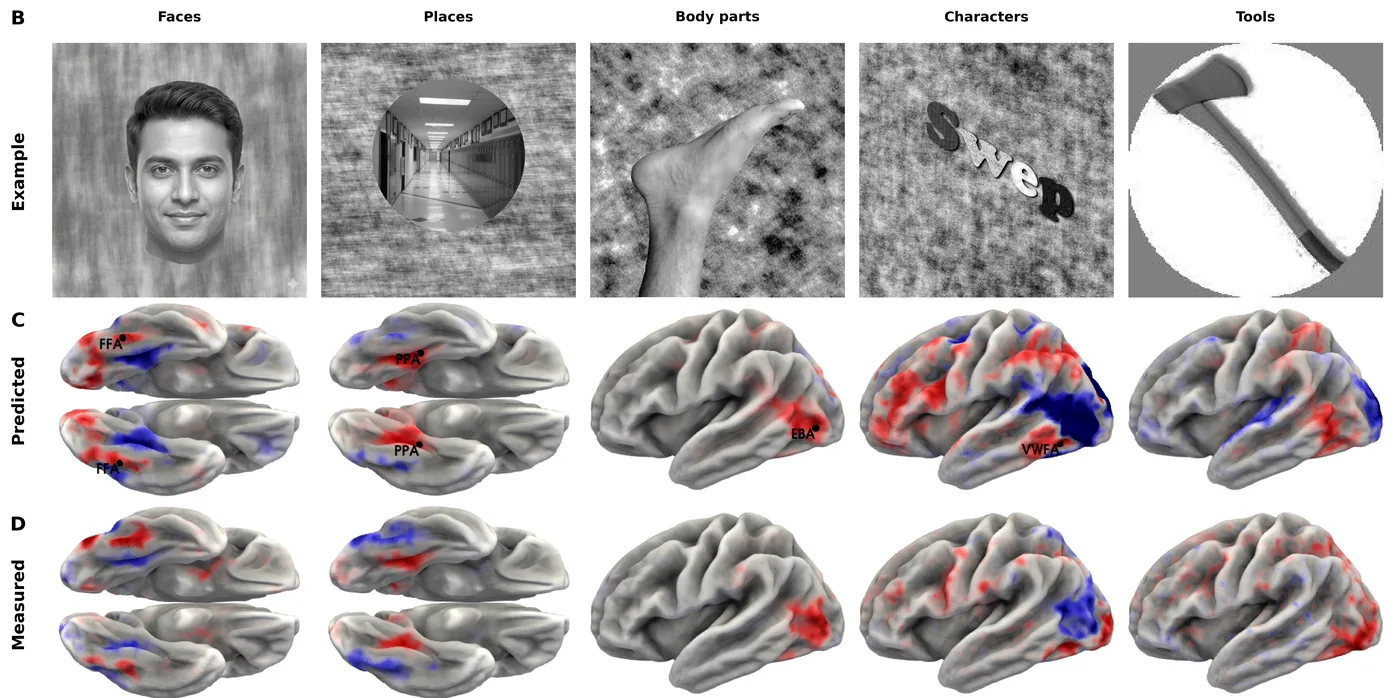
The results text names four of the five categories in that figure. The fifth, tools, is where the prediction mostly fails, and the paper doesn’t comment on it in the text I read. One weak category out of five is not damning, but it shows that “recovers” is doing different work for different stimuli.
The stimuli are stand-ins in places. The language sentences in that battery were in French. The authors translated them to English, synthesized speech with a text-to-speech model, then ran a speech-to-text tool over the audio to get word timings, and fed the result to TRIBE v2. For one task the original movie wasn’t available, so they contrasted speech and non-speech segments from a different dataset instead. None of that is improper, since the model needs timed audio and text. But “recovers a variety of results established by decades of empirical research” describes approximate reproductions of classic contrasts, not reruns.
An independent pair of researchers, Bladon and Bent, probed the model a different way. They ran feature visualization on TRIBE v2 and found a visible progression across the early visual areas, face-like features for the face area, and line patterns for the place area. They also found that images optimized for the face-area response drove it about four times as hard as a natural face photograph, “adversarial super-stimuli rather than canonical exemplars,” and they note that held-out prediction accuracy “tells us an encoder fits the data without telling us whether it has internalized the functional organization of the brain.” I read that as the boundary of what a localizer replication shows. Agreement with findings already in the literature is not evidence the model would get an unknown one right.
The scaling claim
The paper reports a log-linear rise in encoding accuracy with no plateau, and the demo says performance “increases log-linearly as we train it with more data.” In the paper the axis is hours of training data per participant, on the four-subject Algonauts dataset. That says more deep recordings help; it doesn’t say more subjects do. Deep recordings are the scarce kind. The Courtois NeuroMod project scanned six participants for what the paper calls “an unprecedently large recording volume of over 80 hours of fMRI per subject,” and TRIBE v2 trains on a four-subject subset of it curated for the Algonauts 2025 competition, 268.7 hours in all, about 67 hours a person.
What it’s being used for
Meta’s own authors (Benchetrit and colleagues) have already used TRIBE v2 to generate synthetic fMRI for training image decoders, reporting up to a 68 percent improvement in top-10 image retrieval and above-chance decoding from synthetic data alone in some settings. That’s a first-party result. As of today the Hugging Face weights show 42,415 downloads in the past 30 days and the GitHub repository 3,229 stars. Download counts measure curiosity more than use, as I’ve argued before. The license is CC BY-NC 4.0, so noncommercial, and the clinical uses the announcement gestures at remain prospective; the paper itself says integrating “clinical pathology remains a primary goal.”
Of the 720 subjects in the headline, 25 shaped the model’s weights. The other 695 are the reason to believe what it learned, and the paper says so. The announcement and the demo page never do.
References
- d’Ascoli, S., Rapin, J., Benchetrit, Y., Brooks, T., Begany, K., Raugel, J., Banville, H., & King, J.-R. A foundation model of vision, audition, and language for in-silico neuroscience. arXiv:2605.04326, May 5, 2026. Also on Meta AI Research, dated March 26, 2026.
- Meta AI. Introducing TRIBE v2: A Predictive Foundation Model Trained to Understand How the Human Brain Processes Complex Stimuli. Meta AI blog, March 26, 2026.
- Meta. TRIBE v2 demo page. Undated; read September 19, 2026.
- Meta FAIR. facebookresearch/tribev2, README and license (CC BY-NC 4.0).
- Bladon, S., & Bent, B. Feature Visualization Recovers Known Cortical Selectivity from TRIBE v2. arXiv:2605.13904, May 13, 2026.
- Benchetrit, Y., Careil, M., Dahan, S., Banville, H., d’Ascoli, S., & King, J.-R. Boosting Brain-to-Image Decoding with TRIBE v2 Data Augmentation. arXiv:2606.06345, June 4, 2026.
- Hugging Face, facebook/tribev2, and the GitHub repository, download and star counts read September 19, 2026.