On 16 October the Anthropic Institute published a twenty-page technical report, How Employment is Changing at Anthropic, by Nathan Wilmers, Regina Catipon, Maxim Massenkoff and Peter McCrory. One sentence from its key findings did most of the travelling: “By August interactive AI agent hours outnumbered employees’ 6 to 1.” By the weekend The Decoder had agents “logging six times as many work hours as human employees.” Fortune on the 19th wrote that “AI agent hours worked outnumbered the hours worked by humans six to one.” One aggregator ran the headline “Anthropic’s Agents Now Outnumber Its Staff Six to One” before its own body copy corrected the unit to usage time.
The unit is the whole question. An hour of human work is a reasonably settled thing: the Bureau of Labor Statistics counts hours paid in its establishment survey, and says on the same page that the concept differs from hours worked. An hour of agent work is whatever the person holding the stopwatch decides it is. The report holds two stopwatches, and they disagree.
What the runtime clock counts
The 6 to 1 comes from Figure 2, and the note beneath the figure is the only definition the report offers. Three choices sit in it. The sample is limited to “employee-directed interactive sessions,” with subagents pooled, so a session that fans out into ten subagents for an hour contributes ten agent hours. The clock is “agent runtime, including inference and active tool use, but excluding any wait longer than 30 minutes.” And the human side is “headcount and assumed 40 hours per week.”
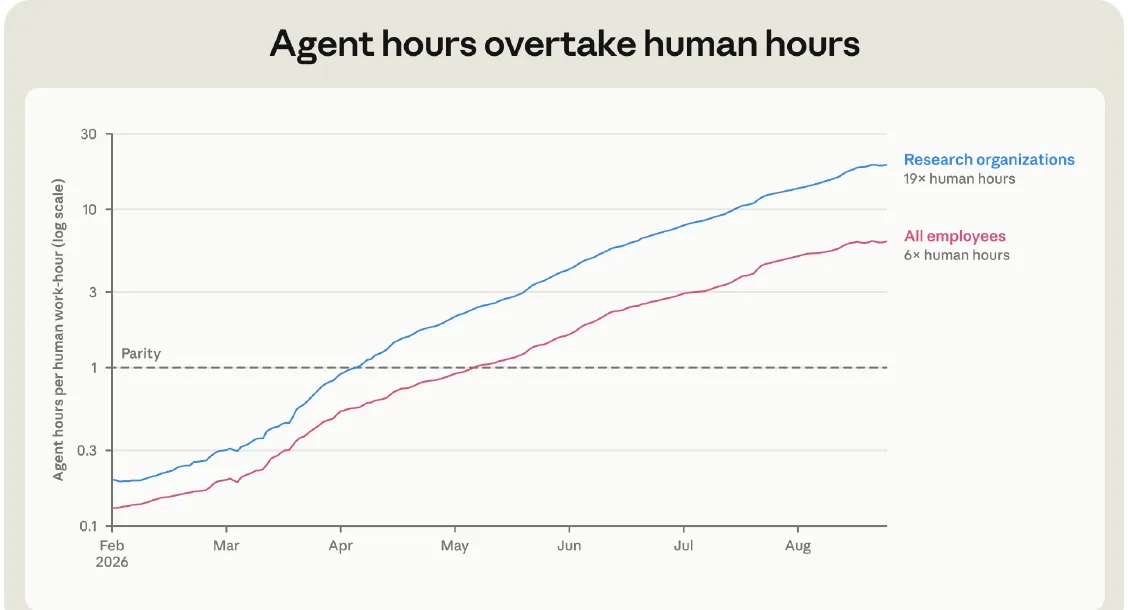
Each choice is defensible on its own. The numerator is the one that can only err in one direction. As I read the note, a wait shorter than 30 minutes stays inside runtime, which is what the figure plots, so a 29-minute pause while the agent waits for a human to answer counts as agent work. The note does not say what kind of wait it means, and if it means that only tool waits are kept and the idle time is already out of Figure 2, then the ratio is 6 and nothing in this section applies. The denominator is a flat assumption, 40 hours per head, which could be high or low, and the report gives nothing to check it against. Its calendar data says what the hours contain rather than how many there are: the median employee spends 20 percent more time in meetings than a year earlier, and technical individual contributors 16 percent more. Neither choice is obviously wrong, but a ratio built that way is a ratio of two accounting conventions, not of two kinds of labour.
Five pages later the report starts the second stopwatch. Measuring idle time “by subtracting each agent’s active working time from each interactive session’s total wall-clock time,” it finds that “Claude sessions amount to around 80% idly waiting for human input.” That is a different clock on the same sessions, and it puts a bound on the first one.
Call a session’s wall-clock time \(W\), split it into active work \(A\), waits shorter than 30 minutes \(S\) and waits longer than that \(L\). The idle clock says \((S + L) / W \approx 0.8\), so \(A / W \approx 0.2\). The runtime clock counts \(R = A + S\), and the share of that which is active work is \(A / R\), which cannot be smaller than \(A / W\). So the ratio of active agent hours to human hours is at least \(0.2 \times 6 = 1.2\) for all employees, and at most the published 6. For the research organizations in the same figure, the published 19 becomes a floor of \(0.2 \times 19 = 3.8\). These are my arithmetic on the report’s two figures, and they rest on three things the report leaves open. The 80 percent is stated for interactive, multi-turn sessions, while Figure 2 is restricted to employee-directed interactive ones, so if the two populations differ the floor moves, and I can’t say in which direction. The 80 percent is also a single undated figure, which I am applying to an August ratio. And the research organizations get no idle share of their own, so the 3.8 borrows the company-wide one.
The direction holds. Even at the floor, agents working for Anthropic employees put in more active hours than the employees did, and by the report’s text the sum of autonomous and interactive agent hours passed human hours in March. The magnitude is open. “Six times as many hours” and “a fifth more hours” are both consistent with what the report publishes, and the number that would settle it, active agent hours with the waits taken out, is one the authors evidently have, since they computed the 80 percent from it.
Other telemetry shows a similar shape. A production-scale study of GitHub Copilot traces from June 2026, by Banruo Liu, Haoran Qiu and colleagues, published on arXiv on 30 July, characterised 13 million sessions from 3.2 million users and found the same shape: sparse user-initiated turns, each unfolding into a fast agent loop, separated by “minutes-long user idle periods at turn boundaries.” The authors built a predictor that captures 86 to 90 percent of total idle time so that serving systems can release resources during it. They publish no idle share, and their interest is in GPU scheduling rather than labour accounting. I found no study in 2026 that measures agent runtime against human hours worked, as of 19 October. The Anthropic report is the first attempt at the ratio I have seen, which is a reason to read its definition carefully rather than a reason to dismiss it.
A share is not a count
The second number that travelled was the junior one. Figure 1 shows the junior share of technical headcount at Anthropic falling from 21 percent to 14 percent since early 2025, and the junior share of technical hires falling from 27 percent to 9 percent. The Decoder’s headline had Anthropic having “nearly stopped hiring junior staff.”
Both figures are shares. The report publishes no headcount levels, and what it says about size points the other way: Anthropic “has tripled in size in the last year,” and the technical departments’ share of the company slipped from 61 percent to 56 percent over the same year as “intensive hiring in sales, finance, and recruiting has outpaced it.” Fortune put the company at more than 3,500 employees, the only headcount figure in the coverage I read, and the report itself gives none.
Put the shares together with the growth. At the start of the window, junior technical staff were 21 percent of a technical workforce that was 61 percent of the company, or about 12.8 percent of everyone. By mid 2026 they were 14 percent of 56 percent, or 7.8 percent. If the company tripled over that window, 7.8 percent of three times the original headcount is 23.5 percent of the original headcount, against 12.8 before. The implied number of junior technical employees rose by roughly 84 percent while every share describing them fell. The arithmetic flips sign only if the company grew by less than about 1.6 times, and the report says three. The pairing is approximate: the 21 percent is from early 2025, where Figure 1 starts, while the 61 percent and the tripling are “the last year,” and the junior headcount share a year ago reads closer to 16 or 17 percent off the chart, which would make the rise larger, not smaller. Treat 84 as a rough size. The report half-concedes the point for the wider group: “technical hiring has continued growing in absolute terms.” And it does speak to junior counts once, in a figure rather than the text. Figure 5 plots junior headcount growth from January to July 2026, job by job, against how complex each job’s Claude tasks are, and most of the jobs plotted sit above zero; the ones that fall are spread from mid to high complexity, and the fitted line only crosses zero near the top of the range. That is the report’s own chart saying that junior employment grew in most jobs plotted over the first half of 2026, under a title that says it fell.
This is the same move I flagged in the R&D automation index last month, a share of a growing total read as if it were a level, and the distinction is not pedantic here, because the studies the report leans on measure the other thing. Seyed Mahdi Hosseini Maasoum and Guy Lichtinger’s résumé-panel study, which I went through in detail on 16 October, counts junior hires per firm-quarter and finds them down by about four against a base of five at adopting firms. Those are counts. Anthropic’s figures are shares, inside a firm that tripled. They are consistent with each other and they are not the same finding.
The gap between share and count turns out to be large wherever someone has measured both. A survey of roughly 750 corporate executives, fielded from November 2025 to January 2026 by Salomé Baslandze and colleagues and published as an NBER working paper in March, has firms expecting the proportion of their workforce doing routine clerical work to fall by 0.76 percent in 2026, against a 0.1 percent AI-attributed decline in total employment across the sample. The share effect is roughly seven times the count effect, which is exactly what you get when a company grows around the roles it stops filling. A study of Chinese listed firms by An, Wang and Zhu in Applied Economics Letters in February finds AI investment raising labour demand, measured from recruitment postings, concentrated in non-routine roles with higher skill and education requirements. It does not measure seniority, but that is the shape a falling junior share takes while demand grows. And Hyunjin Kim and Rembrand Koning’s AI-Native Firms, a Harvard Business School working paper dated 9 June, finds AI-native startups about 25 percent smaller than peers in the same industry and cohort, with entry-level shares roughly 15 percent lower, a cross-sectional comparison between firms rather than a change inside one. The report’s closing pages say prior work finds AI-native start-ups and AI adopters “employ fewer entry-level employees,” and Kim and Koning is the AI-native paper in its works cited. Smaller firms with lower entry-level shares do employ fewer. A firm that triples with a lower share does not.
The junior story may still hold at the level of the economy. The strongest count-based evidence I know of, the August revision of Erik Brynjolfsson, Bharat Chandar and Ruyu Chen’s Canaries in the Coal Mine?, has employment of 22-to-25-year-olds in AI-exposed occupations 19 percent below where it would have been had it tracked their less-exposed peers, through June 2026, working “primarily through reduced hiring.” A level measured against a counterfactual across millions of payroll records is a different and stronger kind of claim than a share inside one fast-growing company, and the report would have been on firmer ground citing it for the economy and its own shares for itself.
The top of the chain
The productivity section is the one the report is most careful about, and it is worth saying what it does and does not show. The authors follow 192 engineers who adopted coding agents against 74 who did not, with person and calendar-month fixed effects, and they say plainly that “tool adoption is not random.” Code commits per engineer come in “at 5x their velocity as 6 months ago.” On quality, they compare code committed by the same employee, in the same month, in the same directory, written by an agent versus by hand, and find “no difference in rates of lines of code subsequently removed or reverted.” That is a real result on six specific proxies, which the figure note lists: lines deleted within 90 days, lines deleted by a bug fix, explicit reverts, lint suppressions, fix-me notes and skipped tests.
Commits are the top of a chain, though, and an independent study that follows the chain down finds most of the gain leaking out of it. Mert Demirer, Leon Musolff and Liyuan Yang’s Writing Code vs. Shipping Code, an NBER working paper issued in May and revised in September, uses telemetry on more than 500,000 GitHub developers and estimates that autonomous coding agents raise commits by about 240 percent. The effect falls to about 80 percent at the level of projects and about 30 percent at the level of releases, with an elasticity of substitution between AI and human effort of 0.23, which the authors read as a human bottleneck. Anthropic’s 5x is a commit figure. The report has no release figure for engineering, though it does have output measures that sit lower in the chain for other functions: deals closed per sales representative, contracts processed by lawyers, invoices by accounts payable. A release-level figure for engineering would be the comparable number, and the report does not have one.
The bottleneck the report describes most vividly is reading. Converting each session’s output tokens to words at 0.75 words per token and 250 words a minute, it finds that even non-technical employees’ interactive sessions produce enough text “to take up over half of the work week.” One engineer compared the experience to babysitting, with every agent’s request voiced at the same pitch, and another to facing “an army of Claudes, with every one asking for my attention.” The 80 percent idle figure and the half-a-week reading figure look to me like the same fact from two sides: the agents are waiting for the humans to catch up.
There is an old precedent for the tier the report says is thinning. In 1832 Charles Babbage described, in On the Economy of Machinery and Manufactures, how Gaspard de Prony had organised the computation of the French mathematical tables commissioned after the Revolution, when the government wanted tables for its new decimal system. The work was split into three sections: “five or six of the most eminent mathematicians in France,” who chose the formulas; “seven or eight persons of considerable acquaintance with mathematics,” who converted the formulas into numbers; and a third section that “varied from sixty to eighty” computers, who did nothing but add and subtract, “nine-tenths” of whom knew no arithmetic beyond those two operations. Babbage told the story to show that the division of labour applies to mental work as well as manual, and added that his engine would be “a substitute for the whole of the third section of computers.” The third section was the junior tier. He did not record how many hours the engine would spend waiting for the first section to tell it what to add. The parallel to agents has been drawn before, and I don’t claim it; what is new is a firm publishing the ratio.
Two numbers would settle most of this, and both already exist inside the telemetry the report was built from. One is active agent hours, which is the runtime clock with the waits it keeps taken out, and which the authors must have computed to get the 80 percent. The other is junior technical headcount by month, which is what the shares were divided into. The report chose to publish a ratio and a share instead. Both move in the direction it describes. Neither says how far, and the coverage filled that gap with the largest number on the page.
References
- Wilmers, N., Catipon, R., Massenkoff, M. and McCrory, P. (2026). How Employment is Changing at Anthropic. The Anthropic Institute, technical report, 16 October 2026. Landing page: anthropic.com/research/employment-at-anthropic.
- Bastian, M. (2026). Anthropic has nearly stopped hiring junior staff because AI agents now work six times as many hours. The Decoder, 18 October 2026.
- Quiroz-Gutierrez, M. (2026). ‘An army of Claudes, with every one asking for my attention’: Anthropic calls human attention the bottleneck in the botsitting world to come. Fortune, 19 October 2026.
- ToolNavs (2026). Anthropic’s Agents Now Outnumber Its Staff Six to One: Hiring Moved First. 16 October 2026, updated 19 October.
- U.S. Bureau of Labor Statistics. Handbook of Methods: Current Employment Statistics, Concepts. Last modified 28 February 2025.
- Liu, B., Qiu, H., Goiri, Í. et al. (2026). Agentic Coding in the Wild: Characterizing GitHub Copilot Traces at Production Scale. arXiv:2608.00101, 30 July 2026.
- Hosseini Maasoum, S. M. and Lichtinger, G. (2026). Generative AI as Seniority-Biased Technological Change: Evidence from U.S. Résumé and Job Posting Data. SSRN working paper 5425555, version of 6 May 2026.
- Baslandze, S., Edwards, Z., Graham, J., McClure, C. et al. (2026). Artificial Intelligence, Productivity, and the Workforce: Evidence from Corporate Executives. NBER Working Paper 34984, March 2026.
- An, Y., Wang, X. and Zhu, Y. (2026). Artificial intelligence investment and corporate labour demand: evidence from corporate hiring. Applied Economics Letters, 10 February 2026.
- Kim, H. and Koning, R. (2026). AI-Native Firms. Harvard Business School Working Paper 26-090, 9 June 2026.
- Brynjolfsson, E., Chandar, B. and Chen, R. (2026). Canaries in the Coal Mine? Six Facts about the Recent Employment Effects of Artificial Intelligence. Stanford Digital Economy Lab, August 2026 revision.
- Demirer, M., Musolff, L. and Yang, L. (2026). Writing Code vs. Shipping Code: Productivity Effects Across Generations of AI Coding Tools. NBER Working Paper 35275, issued May 2026, revised September 2026.
- Babbage, C. (1832). On the Economy of Machinery and Manufactures, chapter “On the Division of Labour,” sections 241 to 245. Project Gutenberg transcription.